 Seldon
What viral seeding actually costs, measured on 79,966 posts
Last updated
#viral seeding#seeding#gifting#cost per 1,000 views#creator fee#seeding campaign#influencer marketing
We took a random sample of 79,966 pieces of influencer content from campaigns we ran, split it by the two seeding structures we use most, and compared them. The more expensive structure returned 3.9 times the average views. It also returned fewer views on the typical piece. Both of those are true at the same time, and which one you should care about depends entirely on what you are buying.
Most agencies do not publish these numbers. The ones that do tend to publish the average. By the end of this you will understand why.
Is seeding the same as gifting?
No, and the confusion costs people money. Gifting — sending product to creators and hoping something comes back — is one tactic inside seeding. Seeding is the larger category: any campaign that places a product with many creators in order to manufacture reach.
Our own seeding campaigns run from under USD 50 per piece of content to several thousand, across three or four structurally different types. This article covers the one we run most, which is also the one people usually mean by viral seeding. It sits inside a larger frame we laid out in the four types of influencer marketing.
What did we measure, and on what sample?
79,966 pieces of content, randomly sampled from campaigns we executed. We aimed for 80,000 and stopped just short on purpose: we sampled whole campaigns rather than pulling individual pieces out of them. A half-included campaign would distort the distribution, and the distribution is the entire point here.
Performance marketing is excluded. These are seeding numbers only.
| Group A | Group B | |
|---|---|---|
| Cost per piece, creator fee included | USD 246.14 | USD 119.55 |
| Median views | 1,346 | 1,654 |
| Average views | 31,060.6 | 7,941.9 |
Group A costs 2.06 times as much. It returns 3.91 times the average views. And its median is 18.6% lower.
Why does the cheaper group have the higher median?
Because Group A's distribution is far more skewed. Its average sits 23.1 times above its median. Group B's sits 4.8 times above.
A median of 1,346 against an average of 31,060 means most pieces in Group A do ordinary numbers while a small handful do enormous ones. The average is being carried by the tail. Group B has a tail too — every seeding campaign does — but a much shorter one, and a body that sits higher.
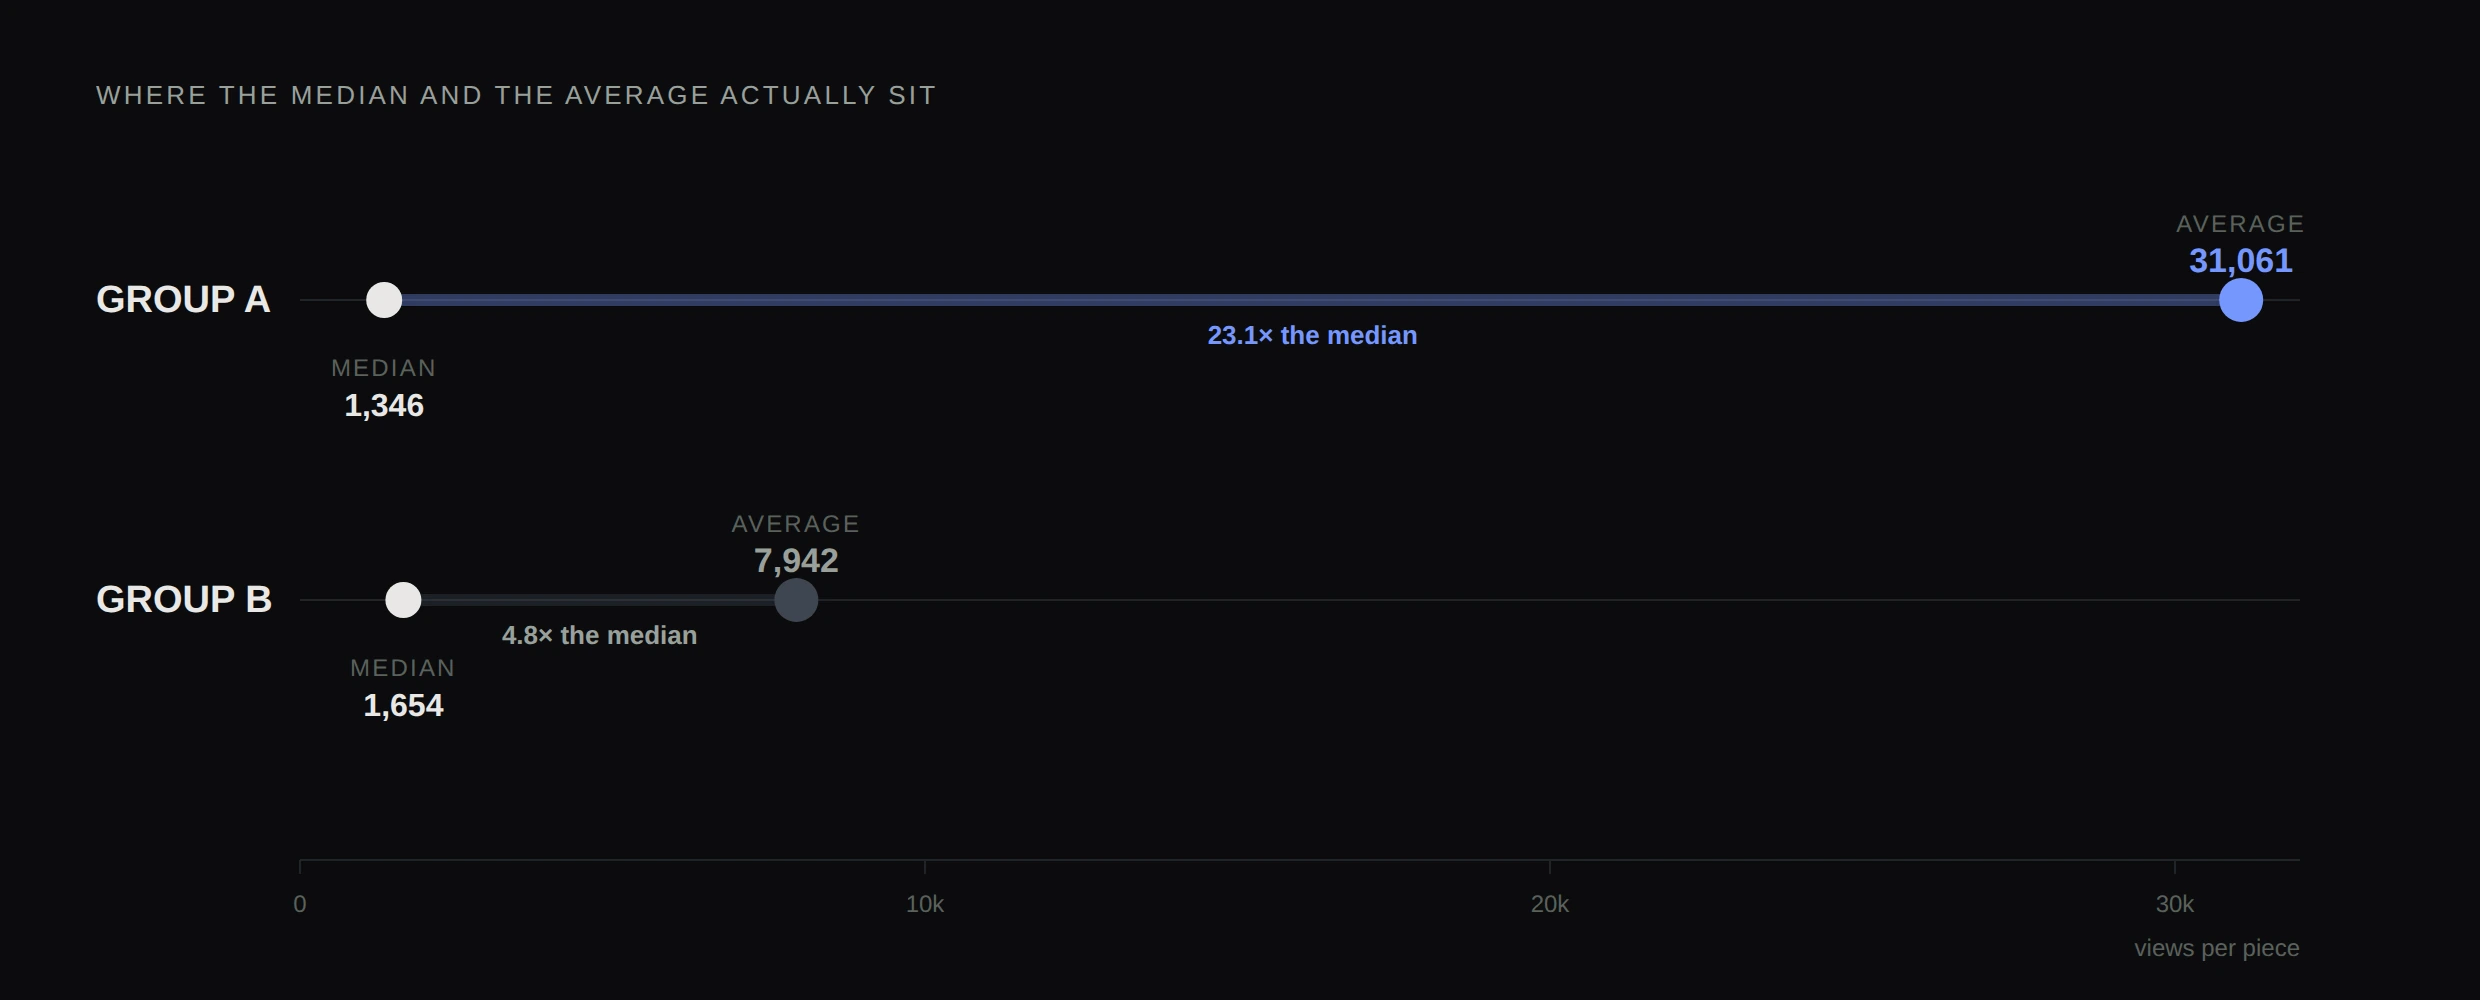
So these are not a better option and a worse option. They are two different bets. Group B buys a floor. Group A gives up floor to buy a ceiling.
What does a view actually cost?
Here the reversal becomes concrete. Same data, divided two ways.
| Cost per 1,000 views | Group A | Group B |
|---|---|---|
| On the average piece | USD 7.92 | USD 15.05 |
| On the typical, median piece | USD 182.87 | USD 72.28 |
On averages, Group A is 1.9 times cheaper. On the typical piece, Group A is 2.53 times more expensive.
Neither figure is wrong and neither is sufficient. If you are manufacturing a moment and you can absorb variance, the average is the number that governs, and A wins on it. If you need each piece to earn its own cost, the median governs, and B wins.
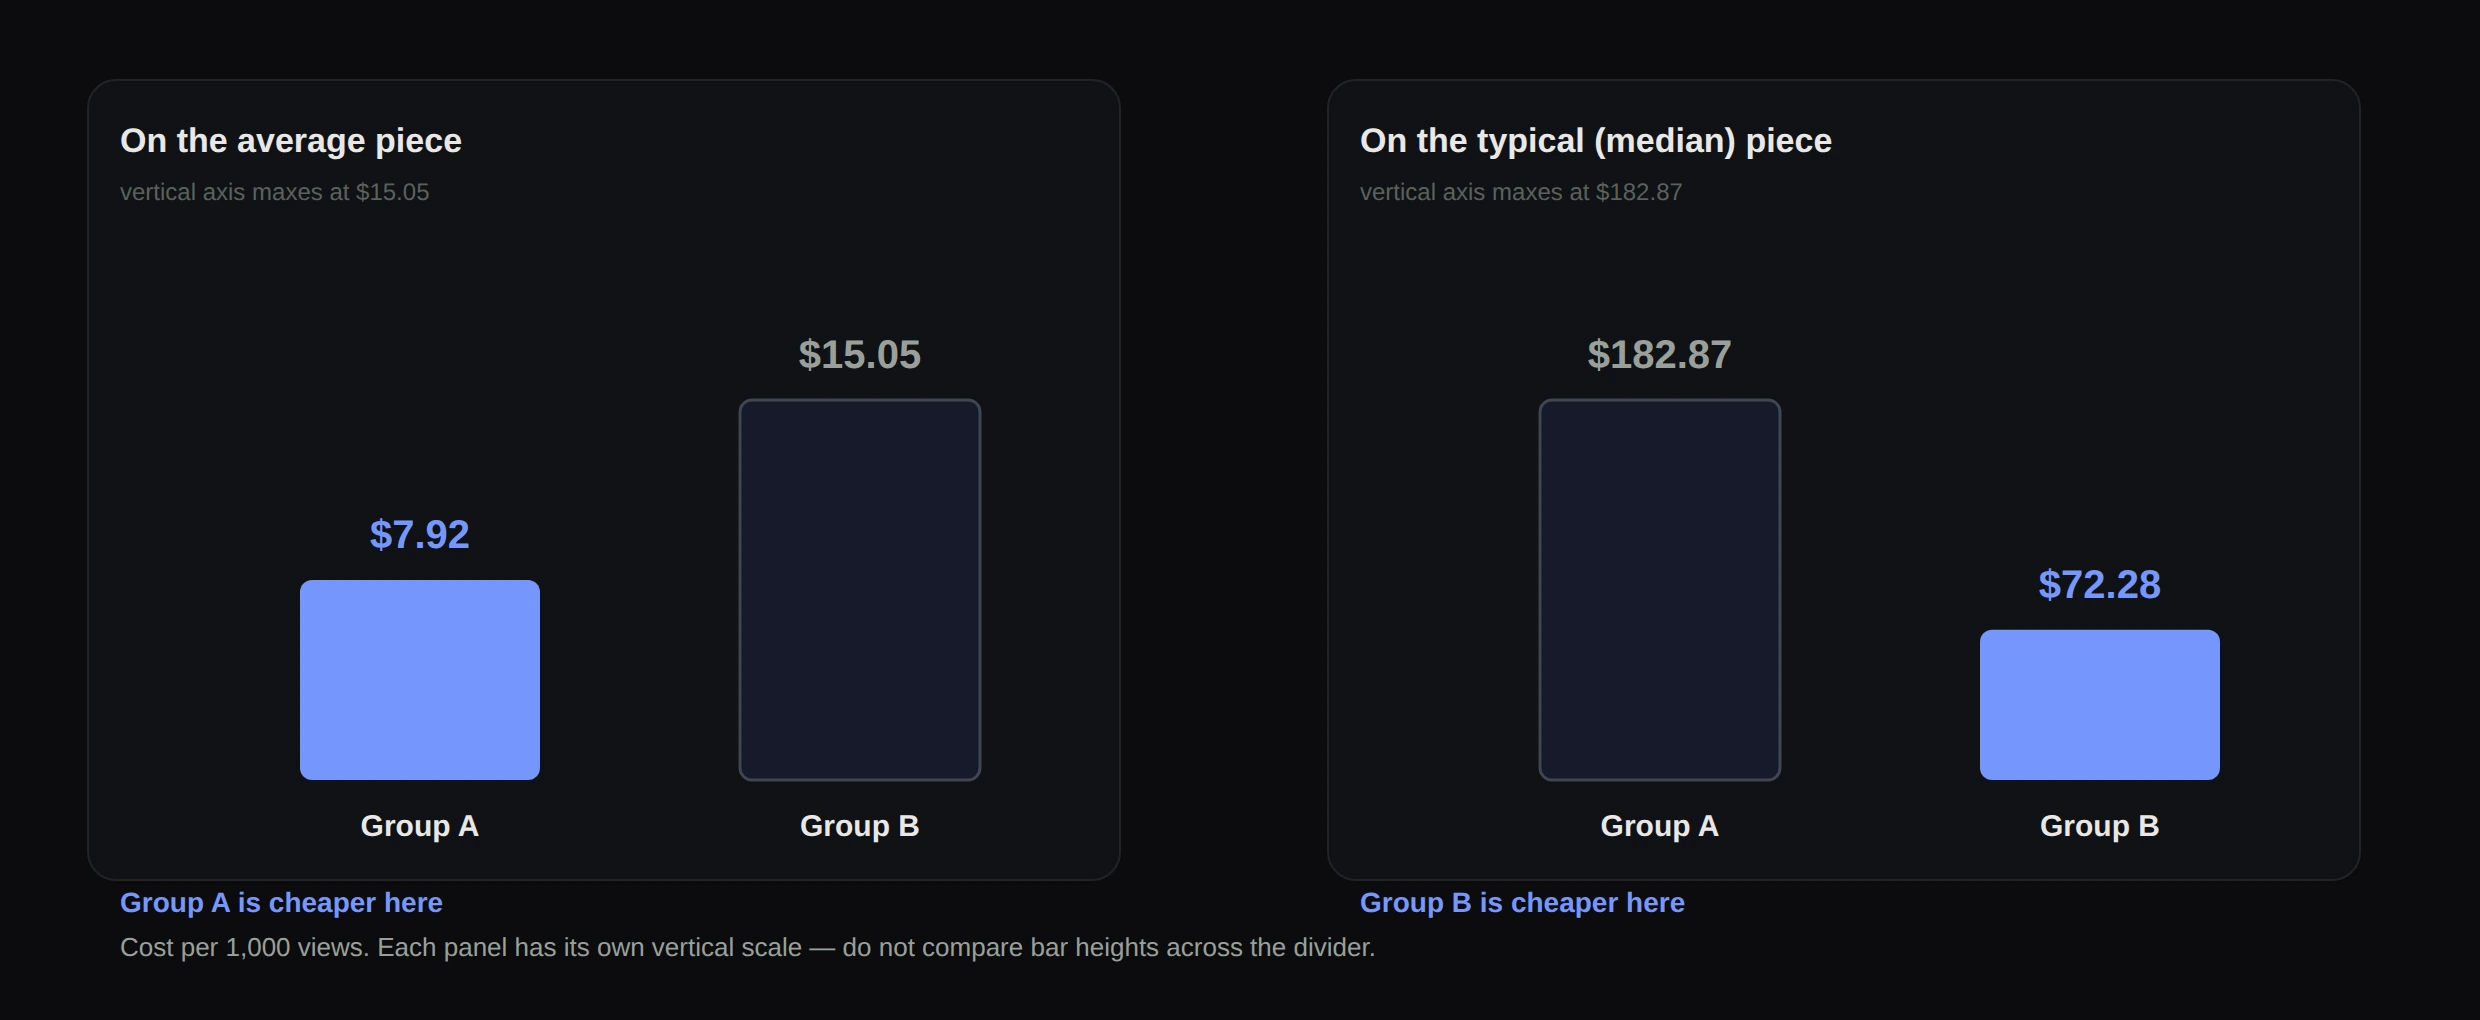
This is also why most published seeding benchmarks are close to useless. Almost all of them report averages, and an average from a distribution this skewed describes a campaign that did not happen.
What actually separates the two?
Not the creators. Both groups use the same selection method. For every campaign we pick only creators who are demonstrably similar to one another in the platform data, so that the recommendation system reads the batch as one cluster rather than as scattered posts.
Two things differ, and both are decisions we make before a creator is contacted.
How tightly the campaign is specified
Group A campaigns are designed in fine detail. Group B campaigns are briefed loosely, and the difference is not small — one is a plan, the other is a direction.
How hard that specification is enforced
This is the larger of the two. In Group A the plan is built down to the second and creators are required to execute it, so the output is deliberately close to identical across pieces. In Group B creators are left room to interpret.
Enforcement is most of the price gap. Constraint is expensive twice over: you pay for the planning, then you pay creators more to give up their own judgment. What you buy with it is similarity, and similarity is the thing a recommendation system reads as a trend.
Worth noting what this is not. The 2011 study most seeding advice still rests on found that strategy choice could produce up to eight times the success of a weaker one, but its variable was whom you seed to — position in the network. Here creator selection is held constant. The 3.9x sits entirely in how specified the brief was and how hard it was enforced.
Which one should you run?
Start from what your budget survives rather than from which number looks better.
If a program needs a floor — a steady volume of content live, each piece pulling its weight, and a run of duds would hurt — run B. If you are trying to manufacture a moment and have enough budget that a run of duds does not end the program, run A. Budget size changes the answer completely, which is why influencer strategy advice that never asks about budget is worth what you paid for it.
Most real programs should run both. Seeding has three or four structurally different types and they mix; the right question is not which one is best but which mix your situation can afford.
We published these figures because this industry mostly does not, and those who do tend to publish the flattering half. Our renewal rate runs above 80%, which we read as a sign the work holds up, but whether these numbers are good or bad for your situation is yours to decide and not ours to announce.
One practical note. You cannot tell A from B inside your own reporting unless every seeded link is tagged the same way from the first day. At a few hundred pieces you can reconstruct it by hand. At tens of thousands you cannot, and no analysis afterwards will recover what was never recorded. Our UTM builder enforces a convention, which is the only reason conventions survive a campaign this size.
Questions people ask
How much does influencer seeding cost per piece of content?
In our sample of 79,966 pieces, the two structures we run most often cost USD 246.14 and USD 119.55 per piece including creator fees. Seeding as a whole runs from under USD 50 to several thousand per piece depending on how the campaign is structured.
Is influencer seeding the same as gifting?
No. Gifting is one tactic inside seeding, not a synonym for it. Seeding is the broader category: any campaign that places a product with many creators in order to manufacture reach.
Why is the median more useful than the average in seeding?
Because seeding view counts are heavily skewed. In our data the average sat 23.1 times above the median for one structure, so the average describes a piece of content that did not actually happen.
What makes one seeding campaign outperform another?
In our data it was not creator selection, which was held constant across both groups. The difference was how tightly the campaign was specified before launch and how strictly creators were required to follow that specification.
FOR YOUR BRAND · INDENT
Ready for your brand’s next market?
Looking for creators and a campaign that fit your brand? Talk to Indent about global influencer marketing.
Sources
- Hinz, Skiera, Barrot & Becker — Seeding Strategies for Viral Marketing: An Empirical Comparison, Journal of Marketing (2011)journals.sagepub.com · checked 2026-08-16
- American Marketing Association — Seeding Strategies for Viral Marketing: An Empirical Comparison (summary)ama.org · checked 2026-08-16